We expect to run slower as we get older, but by how much? WAVA factors attempt to account for slowing with age by giving a correction factor for the time, dependent upon age and distance (see calculator). In addition there are overall and hence (by using the factors) age-graded "standards" which allow different events to be compared.
Current age-group world records (data) do not yet meet these standards - in particular, the effect of age is close to constant across all distances, and super-veteran (aged over 60 or so) athletes run more slowly at the moment than expected. Conversely, some veteran athletes (see discussion on Masters track and field egroup) think that their WAVA age-graded results are too generous, which might imply that the spread of performances below age-WRs decreases with age, perhaps as the number of active competitors dwindle, leaving only the better athletes.
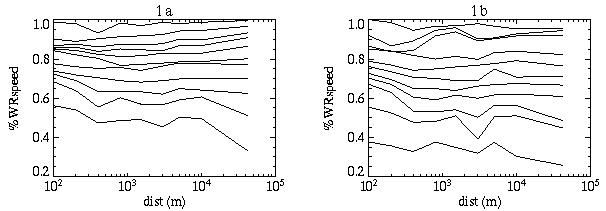
The age-group world records, show a similar pattern to the overall world records (Figure 3, main page), i.e. speed decreases with distance, but what we are really interested in is the performance relative to the overall world record, as a measure of what is achievable (we actually use the WAVA age standards as the benchmark, rather than the current overall WRs, which can be quite variable, or we can smooth the records as for performance calculator). The %(all)WR(speed) (1a men, 1b women) for each age-group record shows a relatively flat response to distance - i.e. older athletes get slower (when measured as %WR(speed)) roughly equally at all distances (obviously there is some scatter for individual records).
The decline in %(all)WR(speed) is approximately linear with age (2a men, 2b women) for all distances, with men declining a little more slowly than women.

Thus, in the same way as for a performance relative to the overall world record, we can calculate the %(age-group)WR(speed) to measure performances by athletes at any age (and distance). Since the performances in (a) and (b) are noisy, we smooth these with a simple model (constant across distances at each age, decreasing linearly with age) instead of using the raw records.
Looking in the same way at the WAVA factors shows a slight upturn with distance (3a and 3b), which is not strongly evident from the age-group WRs, and the factors drop off more slowly for older ages, particularly for women (4a and 4b - compare with 2a and 2b).


Calculation of age-graded performance using both the %(age)WR(speed) (fitted by a simple smooth model) and WAVA factors, is implemented in the running calculator and in a set of VBA functions.
There is a lot of interest in masters (age-group) swimming and hence similar age-group world records. It is interesting to look at these in the same way as for running - equivalent plots for short-course (25m pools, 5 and 6) long-course (50m pools, 7 and 8) age-group world records are shown below. The age-group world-record data is available from FINA.
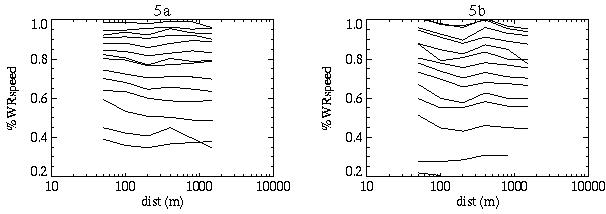
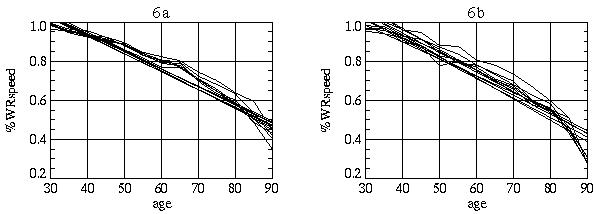
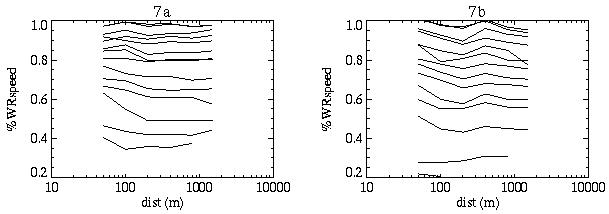

These show a very similar pattern to running - approximately constant (%(all)WR(speed)) across distances, fairly linear decline with age, women decline more quickly than men.
The range of distances involved in swimming is much less than for running, so that detailed models of speed versus distance (as Figure 3 main page) are not needed - a simple %(all)WR(speed) is adequate (VBA functions are available from the author).